Market Sizing
Introducing Occupation-Based Market Sizing
Easily estimate market sizes by profession to find your ideal customers faster with Olympus Intel's occupation-based market-sizing tools.
Learn how to create a bottoms-up market sizing estimate to calculate TAM, SAM, and SOM with real data. A practical guide for entrepreneurs and startups.
When starting a new business, launching a product, or pitching to investors, understanding market size is critical. A bottoms-up approach to market sizing tends to provide reliable, grounded estimates by building the market size from the ground up. Unlike a top-down approach that starts with broad metrics and narrows down, bottoms-up market sizing begins with detailed data and scales up, resulting in more precise, credible estimates.
Bottom-up market sizing involves calculating the market size using granular data such as number of potential customers, units sold, or transactions within a market. It focuses on measurable factors, making it a favored method for building investor confidence, informing go-to-market strategies.
Here you’ll learn some simple steps to create a bottom-up view of your market segments. Olympus Intel’s market-sizing platform takes pages from both bottom-up and top-down methods to give you the most robust view of your market segments possible. It's simple, fast and affordable to get started today.
First, define your addressable units.
Identify the smallest building block of your market. These could be:
Let’s say you’re launching a communication and productivity software suit targeting construction companies. You consider charging for the software based on the number of users a company has or a flat subscription fee for each company. The number of addressable units we want to explore will be the number of firms or number of employees in the construction industry.
Now with the addressable units known, we need data to estimate the number of units in the target market. This data could come from industry reports, publicly available estimates of population / business counts, trade associations or any number of sources or; quality data also varies from industry to industry.
Using the Olympus Intel platform, you’ll quickly see the construction industry consists of ~700,000 firms and employs a little more than 8 million people. These are your total addressable units and building blocks for total addressable market (TAM).
So, under the best theoretical circumstances, your software suit addresses a market of 700,000 firms or 8 million people.
TAM is expressed as a dollar amount. To go from units to TAM, we need to determine the average value per unit–in this case our 700,000 firms or 8 million employees.
The average value per unit can be estimated a few ways. The underlying questions that need answered are deceptively simple–how much will you charge for your solution and how will you charge for it? For calculation purposes, it's pretty straightforward. From a business operations standpoint, this is a critical decision point for many businesses.
Olympus Intel’s market-sizing platform provides numerous ways to explore pricing options and revenue models, with both top-down and bottoms-up lenses. The Market Opportunity Simulator enables quick adjustments of market segments and exploring a number of revenue models, from usage-based pricing to seat-based and more. You can quickly and seamlessly explore the impact pricing structures have on TAM in real time; no tough calculations or data crunching required.
Next, we need to calculate Total Addressable Market (TAM) by multiplying number of units by the revenue per unit.
In our construction example, assume two approaches are being looked at during your market entry analysis. You’re considering charging $99 a month for a business to access your productivity and communication tools. But, you’re also wondering whether you should price based on the number of people using the tools at each company, since you make more from bigger firms than just charging them a flat fee.
So, 700,000 firms * $99 monthly * 12 months =$831,600,000.
The total addressable market of your product under these assumptions is $831m. This isn’t what you’ll target as a sales goal; it represents how much your solution could capture if you achieved 100% market share.
Based on charging by user, it would look something like this:
8,000,000 employees * $5 monthly * 12 months = $480,000,000.

Here, it looks more commercially lucrative to use “enterprise” based pricing. For the purposes of this post, I’ll keep it simple and continue assuming we’re taking the enterprise approach. In a go-to-market study, it's important to understand why the pricing models yield such different TAMs.
Now that you have the best case numbers, we need to create a realistic outlook of what short and medium-term market sizes could be. The medium-term scenario is called Service Addressable Market (SAM–what portion of the market you expect your product to actually be able to service). The shorter view is Service Obtainable Market (SOM–the portion of the market you think you can immediately address and make efforts to capture).
This is where it gets complicated for many startups, business leaders and entrepreneurs and where Olympus Intel removes the guesswork, number crunching and funky spreadsheet math so you can focus on understanding what the results mean for your business.
For service addressable estimates, you account for constraints that inhibit your ability to address specific segments of customers over the medium term. Service obtainable market reflects what your product can realistically capture in the market today, again based on a number of different factors
Let’s say beta testing the construction industry software showed businesses need at least 50 employees to benefit from the tools. While features are slated for future versions to address needs of smaller companies, they won’t be available for the initial product launch.
You’ve also made the decision you will likely never pursue firms with fewer than 10 employees for various reasons.
Lastly, because you’re just starting to go-to-market, you’ll focus exclusively on the West Coast, since that’s where you’re based and travel for demos and pitches will be easier.
How do you dissect and apply this to a market segment? What does it have to do with bottom-up market sizing?
Well, you need to exclude firms with less than 50 employees from your SOM estimates and firms with less than 10 employees from both SAM and SOM. SOM needs to be winnowed to reflect sales presence in the West Coast by including only firms located in those selected states but keep SAM at a national level as sales presence will grow over time.
The tools, resources, time and knowledge needed to dissect all the different components needed for all the above is often out of reach for a founder. That’s why our market-sizing platform makes it easier for entrepreneurs, leaders and founders to get the data and insights needed to grow. Our tools allow you to adjust for these considerations quickly and easily. SAM and SOM estimates are updated instantly based on your inputs.
In a crowded market or highly regulated space? Have your own estimates of product adoption rates? Our tool handles these considerations and more.
The final result, based on our industry, pricing, different considerations across employment sizes, geographies and other market factors results in the following:
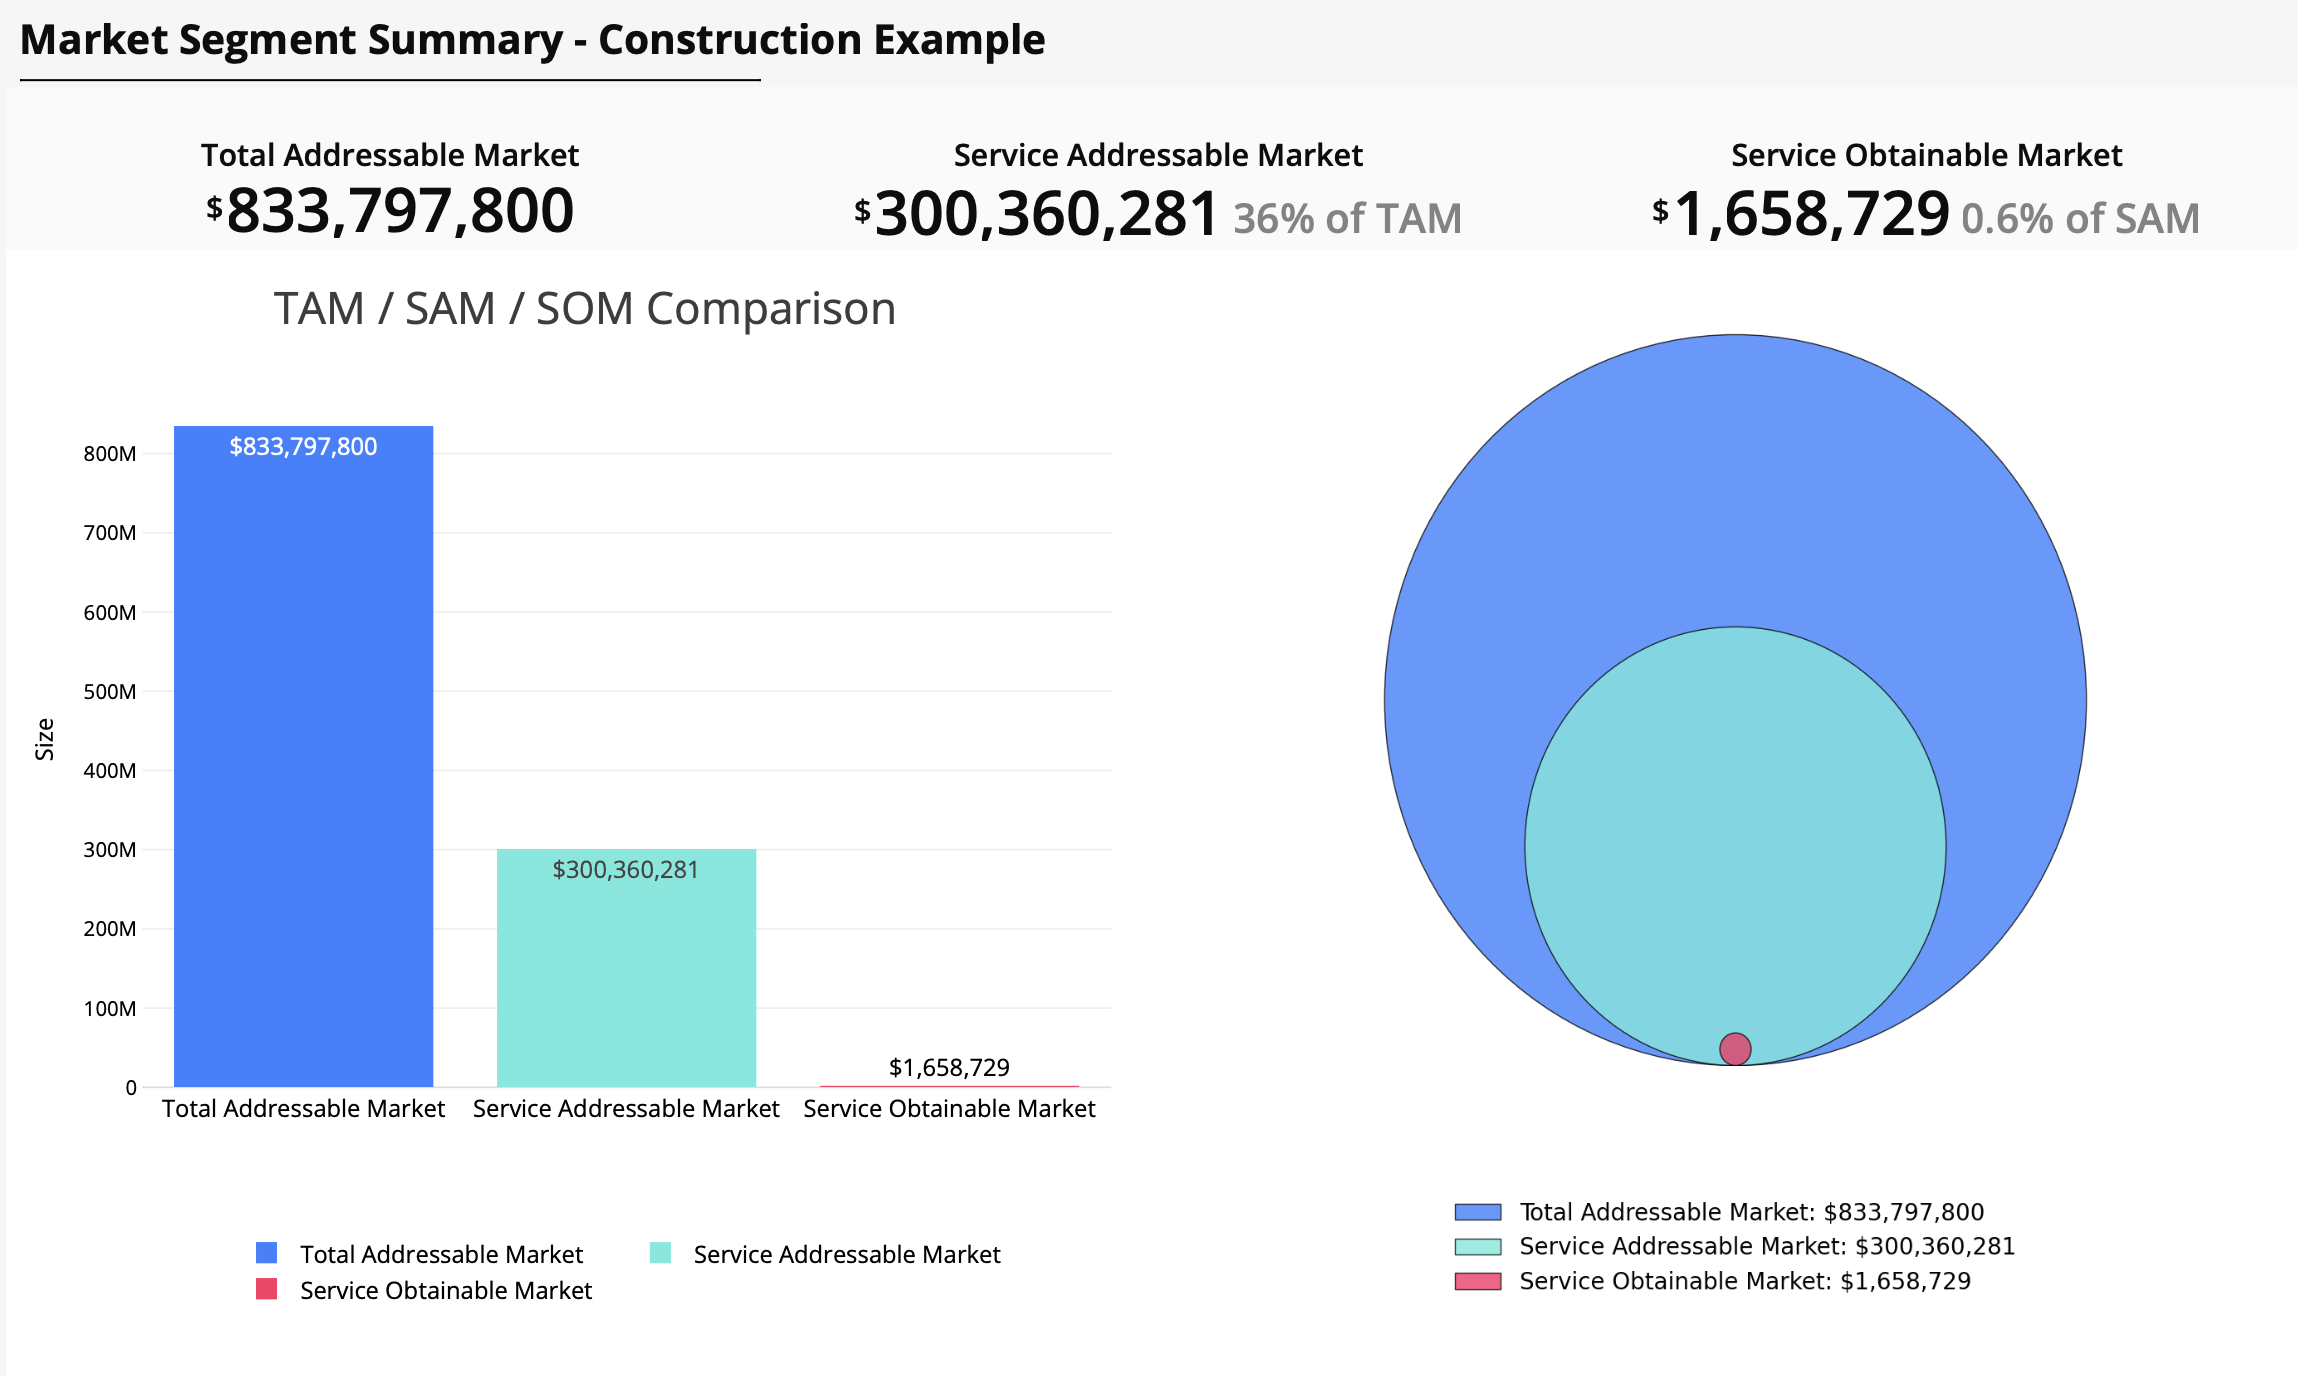
A bottoms-up market sizing approach stands out because it focuses on tangible, real-world data, offering a level of credibility and precision that stakeholders trust. Relying on details such as specific customer segments or transaction volumes allows entrepreneurs to present defensible market estimates—key to building confidence with investors, partners, and internal teams.
Unlike top-down methods, which rely on assumptions from broader industry metrics, bottoms-up sizing can ensure accuracy by building calculations from the ground up. This approach is especially valuable for niche markets, where macro-level data may not reflect the true potential of your target audience.
A bottoms-up methodology is also flexible and adapts to change. If you’re scaling, entering new regions, or exploring different pricing models, bottom-up estimates are able to evolve alongside strategic decisions. It provides the granularity to adjust estimates as your business grows or market dynamics shift.
While a bottoms-up approach has clear advantages, it’s not without challenges.
Data Availability: Finding and accessing granular, high-quality data is time-intensive and resource-draining. Public data sources may not always provide the depth required or be readily accessible to the layperson; industry reports often come at exorbitant prices. Many find they need to combine multiple data sources or invest in specialized tools to overcome these hurdles.
Estimating Revenue per Unit: Determining how much a customer or business will spend on your product requires thorough market research, prospect/beta feedback or surveys. Without accurate pricing insights, TAM estimates risk being either overly optimistic or too conservative.
Scalability: Adjusting for multiple geographies, customer segments, or revenue models adds layers of complexity. For example, understanding how adoption rates vary across regions or industries can complicate calculations, particularly when data isn’t evenly distributed or readily available.
Addressing these challenges requires the right mix of tools and insights to simplify the process, ensure accuracy, and reduce precious time spent on manual data aggregation or analysis.
A bottoms-up market sizing estimate can be the strategic foundation for your business. Starting with real-world data and scaling upward, you can uncover opportunities, refine strategies, and communicate your market potential effectively to stakeholders. Though challenges like data availability or scalability can arise, having a structured approach and the right tools can help you navigate them with confidence.
Olympus Intel makes bottoms-up sizing accessible to everyone, from first-time entrepreneurs to seasoned founders. With tools designed to address data gaps, explore revenue models, and refine estimates in real time, you’ll gain actionable insights in minutes, not weeks.
Get started today and let Olympus Intel take the guesswork out of market sizing.
Easily estimate market sizes by profession to find your ideal customers faster with Olympus Intel's occupation-based market-sizing tools.
Elevate market analysis with AI-Powered Insights on Olympus Intel. Save time, enhance understanding, and make better decisions with AI-analysis tool.
Olympus Intel helps an investment firm smartly expand their portfolio into a new market industry.
